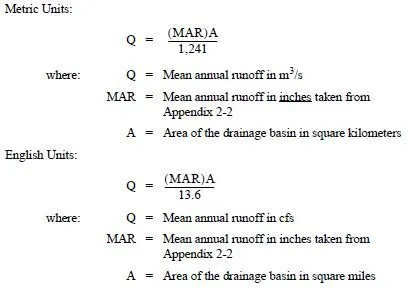
While measured flows provide the best data for design purposes, it is not practical to gage all rivers and streams in the state. A set of equations have been developed by the USGS to calculate flows for drainage basins that do not have a streamflow gage. The equations were developed by performing a regression analysis on streamflow gage records to determine which drainage basin parameters are most influential in determining peak runoff rates.
The equations break the state up into nine unique hydrologic regions. A map of the regions can be found in Appendix 2-2. The various hydrologic regions require different input variables so the designer should determine which set of equations will be used before gathering data for the analysis. Appendix 2-2 also contains precipitation information that is required input for many of the equations. Other input parameters such as total area of the drainage basin, percent of the drainage basin that is in forest cover, and percent of the drainage basin that is in lakes, swamps, or ponds will need to be determined by the designer through use of site maps, aerial photographs, and site inspections.
The equations are listed in Figures 2-7.1 through 2-7.9. Each figure contains one set of equations for a hydrologic region of the state. Each figure also lists the statistical accuracy of the individual equations and describes the required input parameters for the equations and their limits of usage. The designer should be careful not to use data that is outside of the limits specified for the equations since the accuracy of the equations is unknown beyond these points.
The designer must be aware of the limitations of these equations. They were developed for natural basins so any drainage basin that has been urbanized should not be analyzed with this method. Also any river that has a dam and reservoir in it should not be analyzed with these equations. Finally, the designer must keep in mind that due to the simple nature of these equations and the broad range of each hydrologic region, the results of the equations contain a fairly wide confidence interval, represented as the standard error.
The standard error is a statistical representation of the accuracy of the equations. Each equation is based on many rivers and the final result represents the mean of all the flow values for the given set of basin characteristics. The standard error shows how far out one standard deviation is for the flow that was just calculated. For a bellshaped curve in statistical analysis, 68 percent of all the samples are contained within the limits set by one standard deviation above the mean value and one standard deviation below the mean value. It can also be viewed as indicating that 50 percent of all the samples are equal to or less than the flow calculated with the equation and 84 percent of all samples are equal to or less than one standard deviation above the flow just calculated.
The equations were developed with data ranging through the 1992 water year. They represent updates to the USGS regression equations developed for Washington State in 1973 and the designer should disregard the previous version of the equations.
The equations are only presented in English units. While WSDOT is in the process of converting to metric units, the equations were developed by the USGS which is not actively converting to metric units. In the interest of keeping the equations in their original form, no metric conversion was performed for this manual. To obtain metric flow data, the designer should input the necessary English units data into the appropriate regression equation and then multiply the results by 0.02832 to convert the final answer to cubic meters per second.
The OSC Hydraulics Branch has a computer program available for distribution that does the calculations for these equations.