Surveying has two notable characteristics: the work is done to a much higher level of accuracy than most other engineering work and it is easy for quite serious errors to remain undetected until it is too late to correct them. For this reason, there are some inherent principles which should be observed in all surveying, regardless of the type of survey or the equipment used. This chapter describes those principles.
2.1 Errors
All the results of surveying are based on measurements, and all measurements are subject to errors. Because surveying involves high degrees of accuracy (most surveying measurements are accurate to within 10 parts per million and some are within 2 parts per million), it is relatively easy to make errors and relatively hard to detect them. The understanding and management of errors is therefore possibly the single most important skill that a professional surveyor must possess. Many of the techniques of surveying are directed towards cancelling or eliminating errors and towards ensuring that no serious error remains undetected in the final result. Even so, the presence of unnoticed systematic errors in a survey can lead to false, yet seemingly consistent, results. A recent international tunnelling project drifted several metres from its intended path because temperature gradients near the tunnel wall caused laser beams to bend, and this was not detected until an independent method was used to check the work.
High accuracy in surveying is expensive because it involves costly, high-quality equipment and more elaborate procedures for taking measurements. On the other hand, cheaper equipment may not be adequate to achieve the required accuracy, particularly if (for instance) a long distance has to split into several steps, requiring more measurements and resulting in an accumulation of errors. Surveys are therefore often conducted by using high-quality equipment to establish a few major control stations around the area to a higher precision than is required overall, and then filling in the intervening detail by cheaper methods adequate for the shorter distances. This is usually the most economic way of distributing the error budget to achieve a satisfactory final result at minimum cost.
Types of errors
Surveying errors fall into three categories:
1 Blunders (or gross errors) Blunders are due to mistakes or carelessness, such as misreading by a metre or a degree. A proper routine of checks should detect them. A surprisingly common source of error is the manual transcription of readings from one place to another.
2 Systematic errors Systematic errors are cumulative and due to some persistent cause generally in an instrument, but sometimes in a habit of the observer. They can be reduced by better technique, but not by averaging many readings, as they are not governed by the laws of probability. Thus all distances measured with an inaccurate tape or EDM will, from that cause, have the same percentage or absolute error, whatever their lengths and however many times they are measured; the only remedy is to calibrate the device more carefully. This is the most serious sort of error, and the technique of survey is mainly directed against it the greater the accuracy required, the more elaborate and expensive the instruments and the technique. A special type of systematic error is a periodic error, which varies cyclically within the instrument. Examples include errors in the positions of the angle markers on a horizontal circle, or non-linearities in the phase resolver of an EDM or GPS receiver. This type of error can sometimes be eliminated by special observation techniques, e.g. measuring a horizontal angle several times, but using a different part of the horizontal circle on each occasion.
3 Random errors Random errors are due to a number of small causes beyond the control of the observer. Their magnitude depends on the quality of the instrument used and on the skill of the observer, but they cannot be corrected. Thus no one can place a mark, or make an intersection, or read a scale with absolute accuracy or consistency. Even after allowing for systematic personal bias (covered in 2 above), there will remain errors which are a matter of chance and are subject to the laws of probability. In general, positive and negative errors are equally probable; small errors are more frequent than large ones, and very large random errors do not occur at all.
In statistical terms, random errors cause readings to deviate from the correct value in the manner of a normal distribution similar, for instance, to the scatter of heights to be found in a sample of adults. The scale of the scattering can therefore be defined by quoting the standard deviation (σ) of the distribution; two-third of all readings will lie within one standard deviation of the correct value (above or below), and 95 per cent within two standard deviations. Alternatively, the standard deviation for a reading can be estimated by taking the measurement several times, and seeing what range of values covers the middle two-third of the readings; the size of this range is an estimate of 2×σ. Two other measures of quality are also used to define the accuracy of readings affected by random errors. The probable error expressed as ±p is such that 50 per cent of a large number of readings differ from the correct value by less than p; for normally distributed errors, p is 0.675 times the standard deviation of the readings. A more useful measure of accuracy is the 95 per cent confidence value which, as explained above, is almost exactly two standard deviations. Assuming that the observation errors from an instrument have a normal distribution (i.e. that they contain no gross or systematic errors), it can be shown that the standard deviation associated with the arithmetic mean of a set of n repeated observations is times the standard deviation of a single observation. Thus if a single angle measurement can be read to one second of arc, the mean of four readings should have a precision of 0.5 seconds. Taking the same measurement several times can therefore be a valid way of increasing the overall accuracy of a survey.
It is however important to understand the distinction between precision and accuracy. It is possible to read an angle to considerable precision, as described above but if the circle (i.e. optical or electronic protractor) in the instrument is poorly made, the reading will still be inaccurate. Even when the greatest precautions are taken in making a reading (e.g. measuring the angle again using a different part of the circle), systematic errors may still dominate the results. Too much importance must not therefore be attached to the estimated standard deviations (ESDs) of a set of observations, based on the apparent scatter of the results. A set of consistent readings indicates a consistent instrument and a good observer, but not necessarily an accurate result.
2.2 Redundancy
Given two points whose positions are known, the position of a third point in plan view can be found by (for instance) measuring the horizontal distances between it and the two known points. However, the accuracy of the calculated position can only be inferred from the quoted accuracy of the distance measurement device, and a gross error in one of the distance measurements (or an error in the quoted position of one of the known points) will still give a seemingly plausible solution for the new points position.
To overcome both of these problems, a fundamental principle of surveying is to take redundant readings, i.e. to take more measurements than are strictly necessary to fix the unknown quantities. Any large inconsistency in the readings will then indicate a gross error in the measurements or the data, while any small inconsistencies will give an unbiased indication of the likely accuracy to which the point has been fixed.
When several new points are to be fixed simultaneously, it can become quite difficult to ensure by simple inspection that enough suitable readings have been taken or planned to ensure redundancy throughout the network. This soon becomes apparent, though, when the readings are adjusted (see Section 2.4) by computer. For this reason, many adjustment programs include a planning mode, which enables a proposed scheme of observations to be validated for redundancy before it is carried out. A surveyor is strongly advised to carry out such a check, if there is any doubt about the redundancy of a proposed scheme of observations.
2.3 Stiffness
In addition to being redundant, a network (and its associated observations) should also be stiff in other words, the relative positions of control points and the scheme of observations should be arranged such that any significant movement of one of the points would cause a correspondingly significant change in at least one of the observations. This ensures that the positions of unknown points are established to the highest possible accuracy, using the instruments which are available.
There is an exact analogy (as with redundancy) between a stiff network and a stiff structure. The pin-jointed structure shown in Figure 2.1 (a) is stiff, because any given deflection of point C requires that member AC or BC (or both) must lengthen or shorten by a similar amount. In Figure 2.1(b), by contrast, the structure is much less stiff since C can make quite large vertical movements with relatively small changes in the lengths of the two members.
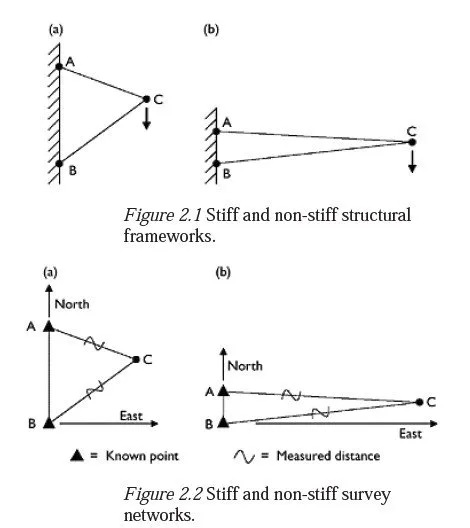
The corresponding situation in surveying is shown in Figure 2.2, where points A and B are known points and C is unknown, and the distances AC and BC have been measured. As with the structure, Figure 2.2(a) shows a stiff network, in which any significant movement of point C would involve equally significant changes to one or both of the measured distances, whereas, in Figure 2.2(b), C could move significantly in the north/south direction without greatly affecting either of the distances. If angle measurements are used as well, this corresponds to adding gusset plates to the structure, which increases its stiffness by removing the freedom in the pin joints. As with redundancy, it can be quite difficult to determine by inspection whether a proposed scheme of observations will result in a stiff network. Again, though, an adjustment program with a planning facility will provide a good prediction of how accurately the unknown points will be fixed, if the likely accuracy of the planned observations is known.
2.4 Adjustment
As explained in Section 2.2, the position of new points should always be found by taking more observations than are strictly necessary. Inevitably, then, the resulting readings will be in conflict; because of the small random errors in the readings, there will be no single set of positions for the new points which will be in exact agreement with all the measurements. To resolve this problem, some form of adjustment is usually applied to the calculated position of the point, to give the best fit with the measurement data. The commonest method is called least-squares adjustment, which chooses positions for the new points such that the sum of the squares of the residual errors1 is minimised. This gives the most likely positions for the new points, assuming that the observation errors are normally distributed. A good understanding of what adjustment can, and cannot, achieve is important for a surveyor. Essentially, it is a statistical process which gives the most likely position for each new point, assuming that the observation errors are random and normally distributed. If this is not the case, the results may be misleading or inaccurate. In particular, least-squares adjustment will give a false impression of accuracy if there are systematic errors present in the data, e.g. if all distance measurements are made using a device which is poorly calibrated. It will also generate misleading results if the user is tempted to reject any seemingly bad observations, purely on the grounds that they do not appear to agree well with the others.
2.5 Planning and record keeping
A successful survey requires an appropriate set of measurements to be taken and recorded, without unnecessary deployment of human resources or equipment. This can only be achieved by means of planning. The following guidelines will improve the quality of any surveying work.
Establish clearly what the purpose of the survey is and what additional uses it might be
put to in the future. This will determine the number and the locations of control points,
and the accuracy to which their positions must be found.
2 Find a suitable map or satellite photograph of the site to be surveyed. This will help in
the creation of a possible network of control points, in suitable locations and with
adequate stiffness. It will also show the approximate scale of the work and will help in
detecting gross errors in angle and distance measurements.
3 Visit the site if at all possible. Check whether control stations can be sited at the places
indicated by step 2 and make a note of what will be needed to build them. If
conventional instruments are to be used, check whether the necessary lines of sight
exist between the station locations, using ranging rods if necessary. If GPS is to be
used, check that the relevant stations have a clear view of the sky. Make notes of any
features on the site (cliffs, ditches, etc.) which might make it difficult to move from
one station to another.
A few simple instruments may also help at this stage. A compass can be used to
estimate horizontal angles, and a clinometer will measure approximate vertical
angles. A hand-held GPS receiver will give the approximate co-ordinates of
points and estimates of the distances between them. If this is not possible, the
distances can be paced.
4 Plan a set of observations which will establish the control network to the required
accuracy at minimum cost. This is generally best done by working from the whole to
the part; accumulated errors are minimised by first forming an accurate framework
covering the whole area and then adding further control stations to whatever accuracy
is necessary. Accurate measurements require expensive equipment and longer
observation times, so this type of consistent approach will give the most economical
result.
The planning function in an adjustment program is very useful here. The eventual
quality of a network can be reliably predicted by entering approximate
observations (such as the compass angles above), together with estimates of the
accuracy to which the final measurement will be made.2 Different observations
can then be included in the scheme, to see which combination will give an
adequate accuracy for minimum investment. Make sure, though, that there are
enough observations so that one or more could be rejected without unacceptable
loss of accuracy or redundancy. The time spent travelling to and from a site is
usually much greater than that needed to take a few spare measurements while
an instrument is set up.
5 Plan the fieldwork in detail to make sure that all the necessary measurements are taken
with the minimum deployment of people and equipment. Each member of the team
should know who will take which measurements, at which locations and with what
instruments.
6 If possible, arrange that all field work has redundancy and that the computations are
carried out such that no incorrect measurement will pass undetected. If some of the
error checks can be carried out in the field, while the equipment is still set up on
station, then the cost of correcting any error will be greatly reduced.
7 Before leaving base, make sure that all batteries are fully charged, and that any
necessary co-ordinate data, transformations, etc. have been downloaded into those
instruments that need it. Make sure that everyone is familiar with the instruments they
will be using; get unfamiliar instruments out, read the instruction manuals and practise
their use.
8 Ensure that each group of surveyors keeps a diary of what is done, including a
summary of the weather, on each day. If an error is discovered later, a good diary can
be invaluable in pinpointing the source of the problem and thus showing which
measurements may need to be repeated.
9 Make sure that observation records are complete and will not degrade with time.
Handwritten records must be legible, and electronic records should be stored securely,
e.g. on a CD. If the information is important, make sure that there are two copies of it,
in different locations; the cost of this is minuscule compared to the cost of taking the
measurements again.
The data generated during a surveying job may need to be consulted years after it was initially made, so good record keeping is also important. Observations recorded on paper should be checked for legibility and completeness, and stored in a dry condition; electronic data should be stored on a permanent medium, such as a CD-ROM. For important jobs, copies of the data should be made and stored in a different location to the originals. Finally, a brief summary of the data will greatly assist any subsequent attempt to re-inspect some part of it.